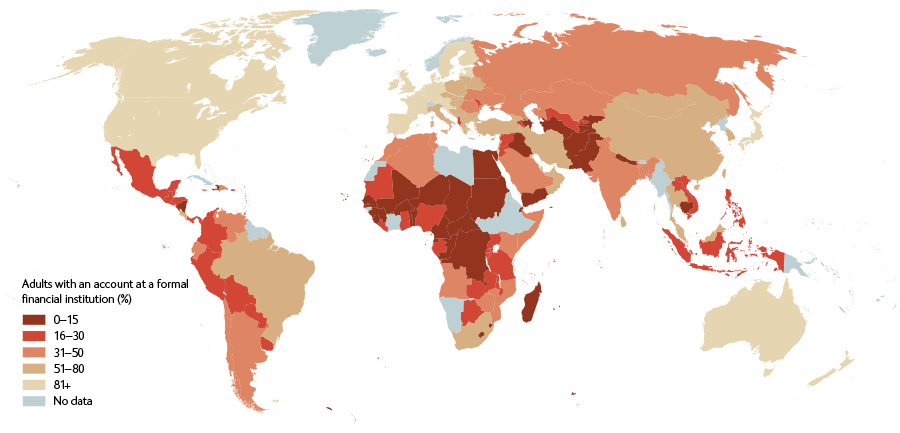
Financial inclusion – measured by bankability and account penetration – remains very low in Sub-Saharan Africa, Central, South and South-East Asia. It has been argued by the World Bank’s “Consultative Group to Assist the Poor” (CGAP) that this is partially driven by self-exclusion by observant Muslims from conventional interest bearing financial products.

According to a 2008 CGAP survey, Islamic microfinance accounts for about 0.5% of global microfinance provision. At the same time, the worth of worldwide Islamic financial assets have leapt from half a million dollars in the 1970s to an estimated US$1.5 trillion today (Global Islamic Finance Report 2016). Ernst & Young (2014) estimates that global Islamic assets will top US$3.4 trillion by 2018. A large dormant demand for Islamic financial products can be assumed, and GEMicro is ready to bridge this gap between supply and demand in emerging markets.

GEMicro currently works with partners in the following markets:

Bangladesh

GDP per capita
$3900 (2016)

GDP by sector
Agriculture: 15.5%
Industry: 28.1%
Services: 56.3% (2015 est.)

Inflation
6.7% (CPI, 2016)

Population below poverty line
31%

Gini coefficient
32.1 (FY 2005–06)

Labour force
83.59 million (2015)

Labour force by occupation
Agriculture: 47%
Industry: 13%
Services: 40% (2010)

Unemployment
4.5% (2013)

Main industries
Jute; cotton; garments; paper; leather; textiles (2017)

Ease-of-doing-business rank
176th

World Bank FINDEX
31% of +15-year olds have a bank account
10% of +15-year olds engage in formal borrowing (2014)

Bosnia & Herzegovina

GDP per capita
$37,966 (2015)

GDP by sector
Agriculture: 8.1%
Industry: 26.4%
Services: 65.3% (2013 est.)

Inflation (CPI)
2.2% (CPI, 2012)

Population below poverty line
42.1% (2011)

Gini coefficient
36.2 (FY 2005–06)

Labour force
1.49 million (2012 est.)

Labour force by occupation
Agriculture 19%
Industry 30%
Services 51% (2013 est)

Unemployment
44.3%% (2016)

Main industries
Steel; coal; iron ore; lead; zinc

Ease-of-doing-business rank
81st (2017)

World Bank FINDEX
53% of +15-year olds have a bank account
14% of +15-year olds engage in formal borrowing (2014)

Chad

GDP per capita
$2,600 (2015)

GDP by sector
Agriculture: 53%
Industry: 12.8%
Services: 51.6% (2016 est.)

Inflation (CPI)
3.8% (CPI, 2016)

Population below poverty line
46.7% (2011)

Gini coefficient
39.8 (FY 2005–06)

Labour force
5.457 million (2016 est.)

Labour force by occupation
Agriculture: 80%
Industry: 20%
Services 20% (2016 est.)

Unemployment
5.6%% (2016)

Main industries
Oil; cotton; textiles

Ease-of-doing-business rank
180th (2017)

World Bank FINDEX
12% of +15-year olds have a bank account
2% of +15-year olds engage in formal borrowing (2014)

Kenya

GDP per capita
$3,400 (2016 est.)

GDP by sector
Agriculture: 16%
Industry: 22%
Services: 61% (2016 est.)

Inflation (CPI)
6.1% (CPI, 2016)

Population below poverty line
43.4% (2012 est.)

Gini coefficient
42.5 (2008)

Labour force
5.457 million (2016 est.)

Labour force by occupation
Agriculture: 75%
Industry: 25%
Services: 25% (2015 est.)

Unemployment
40%% (2013 est.)

Main industries
Agriculture; tourism

Ease-of-doing-business rank
92nd (2017)

World Bank FINDEX
75% of +15-year olds have a bank account
15% of +15-year olds engage in formal borrowing (2014)

Kosovo

GDP per capita
$10,000 (2016 est)

GDP by sector
Agriculture: 12.9%
Industry: 22.6%
Services: 64.5% (2009 est.)

Inflation (CPI)
8.3% (CPI, 2012 est.)

Population below poverty line
30%–45%

Gini coefficient
30 (FY 2005–06)

Labour force
483,200 (2011 est.)
Note: includes those estimated to be employed in the grey economy

Labour force by occupation
Agriculture: 5.9%
Industry: 16.8%
Services: 77.3% (2013)

Unemployment
35.3%% (2014)

Main industries
Mineral mining; construction materials; base metals; leather; machinery; appliances; foodstuffs & beverages; textiles

Ease-of-doing-business rank
60th (2017)

World Bank FINDEX
48% of +15-year olds have a bank account
9% of +15-year olds engage in formal borrowing (2014)

Mali

GDP per capita
$2,300 (2016 est.)

GDP by sector
Agriculture: 41%
Industry: 18.6%
Services: 40.4% (2016 est.)

Inflation (CPI)
0.3% (CPI, 2016)

Population below poverty line
63.1% (2005 est.)

Gini coefficient
33.04 (2008)

Labour force
6.283 million (2016 est.)

Labour force by occupation
Agriculture: 80%
Industry: 20%
Services: 20% (2005 est.)

Unemployment
30% (2015 est.)

Main industries
Mining; agriculture

Ease-of-doing-business rank
141st (2017)

World Bank FINDEX
20% of +15-year olds have a bank account
3% of +15-year olds engage in formal borrowing (2014)

Palestine

GDP per capita
$1924 (West Bank) $876 (Gaza)

GDP by sector
Agriculture: 5%
Industry: 14%
Services: 81% (2008 est.)

Inflation (CPI)
2.7% (CPI, 2016)

Population below poverty line
25.8% (2005 est.)

Gini coefficient
35.5 (2013)

Labour force
1.137 million (2016 est.)

Labour force by occupation
Agriculture: 12%
Industry: 23%
Services: 65% (2008 est.)

Unemployment
27.5%% (2016 est.)

Main industries
Cement; quarrying; textiles

Ease-of-doing-business rank
140th (2017)

World Bank FINDEX
24% of +15-year olds have a bank account
4% of +15-year olds engage in formal borrowing (2014)

Pakistan

GDP per capita
$5,100 (2016 est.)

GDP by sector
Agriculture: 25.2%
Industry: 19.2%
Services: 55.6% (2016 est.)

Inflation (CPI)
2.9% (CPI, 2016)

Population below poverty line
29.5% (2005 est.)

Gini coefficient
30.7 (2013)

Labour force
65.1 million (2016 est)

Labour force by occupation
Agriculture: 42.3%
Industry: 22.6%
Services: 35.1%

Unemployment
6.1% (2016 est.)

Main industries
Textiles & garments; agriculture (wheat, cotton); mining

Ease-of-doing-business rank
144th (2017)

World Bank FINDEX
13% of +15-year olds have a bank account
2% of +15-year olds engage in formal borrowing (2014)

Russia (Chechen Republic)

GDP per capita
$1600

GDP by sector
Agriculture: 8%
Industry: 26%
Services: 52% (2016 est.)

Inflation (CPI)
3.9% (CPI, Russian Federation, 2017)

Population below poverty line
N/K

Gini coefficient
40.1 (Russian Federation)

Labour force
0.8 million (2016 est.)

Labour force by occupation
N/K

Unemployment
15.7% (2014)

Main industries
Mining; quarrying; oil & gas; timber; wheat

Ease-of-doing-business rank
N/K (2017)

World Bank FINDEX
15% of +15-year olds have a bank account
4% of +15-year olds engage in formal borrowing (Russian Federation, 2014)

Sudan

GDP per capita
$4,500

GDP by sector
Agriculture: 27.5%
Industry: 20.7%
Services: 51.8% (2016 est.)

Inflation
20% (2016 est)

Population below poverty line
25.8% (2005 est)

Gini coefficient
46.0 (2016)

Labour force
11.92 million (2007 est.)

Labour force by occupation
Agriculture: 45%
Industry: 45%
Services: 15% (2011 est.)

Unemployment
13.6%% (2014 est.)

Main industries
Cotton ginning; textiles; cement; edible oils; sugar; soap distilling; petroleum refining; pharmaceuticals

Ease-of-doing-business rank
168th (2017)

World Bank FINDEX
15% of +15-year olds have a bank account
4% of +15-year olds engage in formal borrowing (2014)